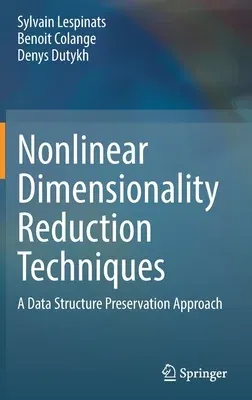
Sylvain Lespinats
(Author)Nonlinear Dimensionality Reduction Techniques: A Data Structure Preservation Approach (2021)Hardcover - 2021, 3 December 2021

Qty
1
Turbo
Ships in 2 - 3 days
In Stock
Free Delivery
Cash on Delivery
15 Days
Free Returns
Secure Checkout

Print Length
247 pages
Language
English
Publisher
Springer
Date Published
3 Dec 2021
ISBN-10
3030810259
ISBN-13
9783030810252
Description
Product Details
Book Edition:
2021
Book Format:
Hardcover
Country of Origin:
NL
Date Published:
3 December 2021
Dimensions:
23.39 x
15.6 x
1.75 cm
ISBN-10:
3030810259
ISBN-13:
9783030810252
Language:
English
Location:
Cham
Pages:
247
Publisher:
Weight:
585.13 gm