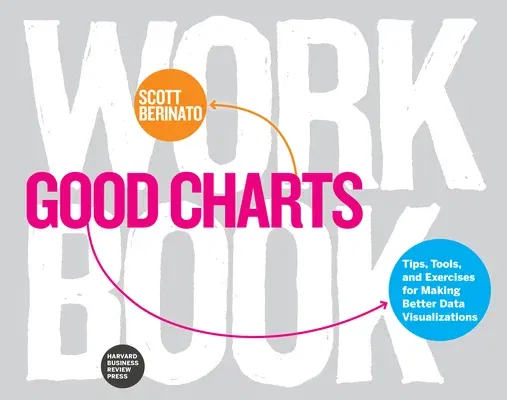
Scott Berinato
(Author)Good Charts Workbook: Tips, Tools, and Exercises for Making Better Data VisualizationsPaperback, 22 January 2019

Qty
1
Turbo
Ships in 2 - 3 days
Only 2 left
Free Delivery
Cash on Delivery
15 Days
Free Returns
Secure Checkout

Print Length
288 pages
Language
English
Publisher
Harvard Business Review Press
Date Published
22 Jan 2019
ISBN-10
1633696170
ISBN-13
9781633696174
Description
Product Details
Author:
Book Format:
Paperback
Country of Origin:
US
Date Published:
22 January 2019
Dimensions:
18.8 x
24.13 x
2.29 cm
ISBN-10:
1633696170
ISBN-13:
9781633696174
Language:
English
Pages:
288
Publisher:
Weight:
793.79 gm